

Executive dashboards are used to accommodate a wide variety of different use cases, but the most popular is the KPI dashboard. A KPI dashboard displays key performance indicators to provide the users with a quick overview of the overall business performance.
Trying to Get a Handle on the Data
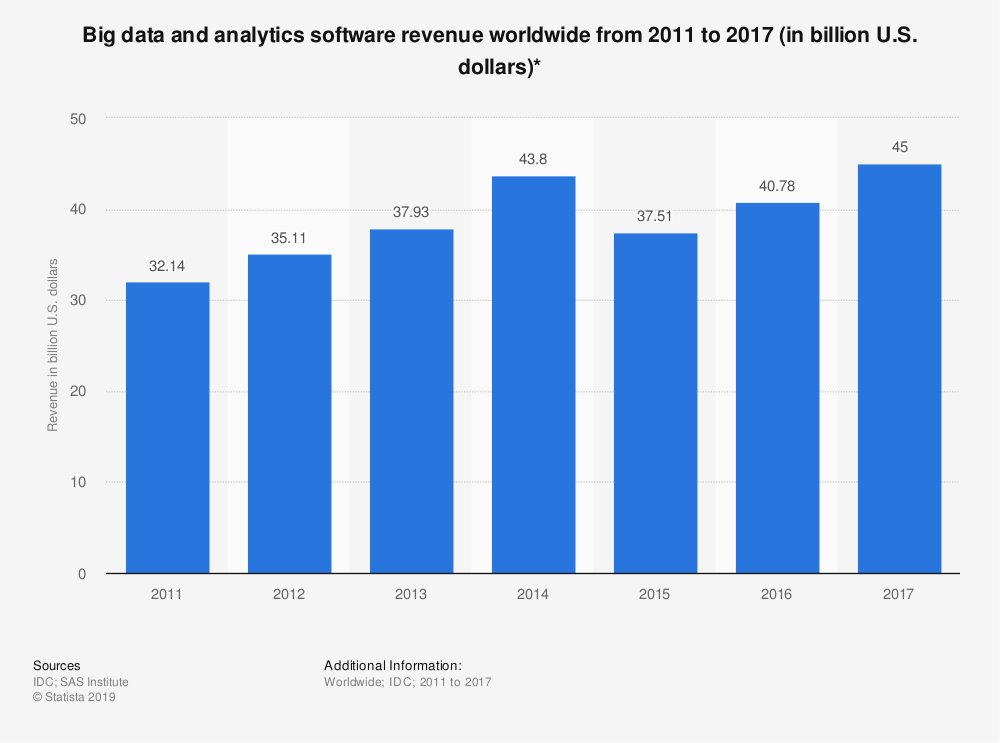
Big data is a buzzword that is on everyone’s lips. Never before has so much information been readily available and measured. In a relatively short period of time, we have shifted from a world that was data-scarce to one where we are experiencing data overflow. IBM estimates that 90% of all data has been created since 2015. As the chart below shows, the market for software that can deal with the problem of big data continues to grow.
Businesses around the world are grappling with how to take all of this data and turn it into actionable information. One way to start to make sense out of the madness is to develop a dashboard that provides information on the organization’s key performance indicators (KPIs).
What are KPIs?
According to Bernard Marr, an intelligent business performance company, “KPIs provide a way to measure how well companies, business units, projects, or individuals are performing in relation to their strategic goals and objectives.”
The company also describes KPIs as “vital navigational instruments” that provide a “clear picture of current levels of performance and whether the business is where it needs to be.” Since every business is different, every business will have slightly different KPIs that best measure the needs of their particular business.
Benefits and Pitfalls of KPI Dashboards
To get the maximum benefit from your KPIs, there are four main criteria that they should meet:
- Actionable – Design KPIs that are tangible and objectively show the improvements that are needed to grow your business.
- Accurate – These are the numbers that are going to guide your organization forward. They should be easy to calculate and interpret, as well as, well-defined, quantifiable measurements of your performance.
- Timely – Don’t get locked into looking backward at your data. Old data is most useful when you use it as a comparison tool with current and forecasted data.
- Impact – If you are taking the time to report KPIs, make sure that it is something that has a direct impact on your bottom line.
Failure to follow these 4 criteria are directly linked to some of the biggest drawbacks or failures that companies experience when putting together and developing KPIs. But let’s walk through a few of the bigger pitfalls that you should try to avoid:
- Measuring Everything – Just because you can easily measure something doesn’t mean that it should automatically be included in your KPI dashboard. Including everything that is measurable will lead to information overload, which is the exact problem that you are trying to solve with your dashboard.
- Copy and Paste – Anyone can find a template that outlines some key KPI dashboard measures, but that doesn’t mean that those KPIs are the ones that your business should be measuring. Your KPIs should be aligned to your business strategy and not what the latest buzzword or measurement trend is.
- Build It and Forget About It – Your business is constantly changing and evolving, which means that you should be checking to make sure that your KPI measures are evolving as well. The measures that you used to help guide you in the past, might not be the measures that you need to push your business forward in the future. So, make sure that you are reviewing and updating your KPI measures for where you want your business to go.
- Decoration – KPIs and the information that they provide are only effective if you actually take the data and do something with it. They shouldn’t just be another reporting tool that gets buried in your inbox. KPIs should be used to help shape the key decisions that are affecting your company going forward.
How to Build a KPI Dashboard That You Can Display
Ok, now that the hard work of finding the right KPIs for your business is out of the way, it’s time to get down to how to build your KPI dashboard. There are a wide range of KPI dashboard software providers on the market, but remember that this is a case where you want to keep things relatively simple. So, here are some of the ones that we recommend you check out to see if they meet your needs:
- Databox – They focus on combining all of your different data systems into one place to provide real-time data information. You can mix and match the different systems based on your business needs. They also offer a free account. So, you can set up three dashboards to try them out and see if they work for you.
- SimpleKPI – This software is designed to take the heavy lifting out of building a KPI dashboard. They also keep their pricing structure simple, by offering one level of service which includes everything: unlimited users, dashboards, reports, and KPIs. Finally, they have a free trial, so you try before you buy.
Time to Put Your Dashboard on Display
The moment of truth has arrived. You’ve invested time in developing your operational dashboard composed of your specific strategic goals and avoided some of the common pitfalls. You’ve chosen the data sources and software provider that works best for you. But what good is all of this information if no one is paying attention to it. ?
The most common way is to set a daily reminder email that goes out to everyone with the latest dashboard information. Or you can send out a link to an internal website where everyone can access the business dashboard. The problem with both of these options is that they are likely to ensure that all of your hard work is slowly forgotten about.
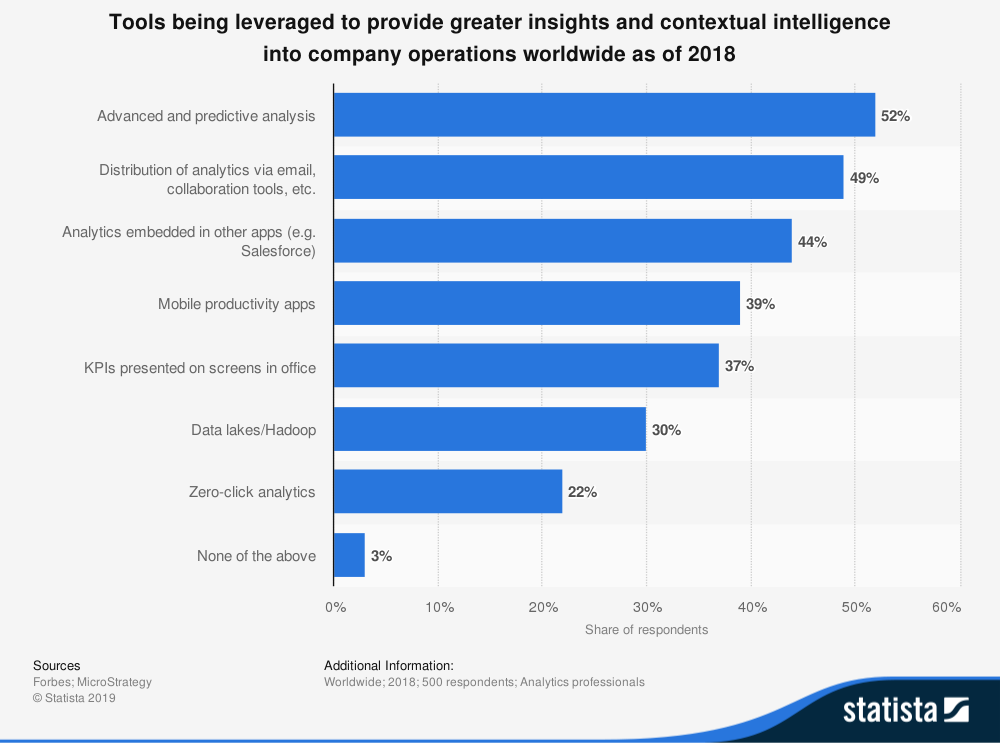
That is why the percentage of companies that presenting KPIs on screens throughout their offices has grown to represent 37% of the tools being leveraged to provide greater insights in 2018.
This is where viewneo can help. We provide a complete Digital Signage cloud-based platform that allows you to easily add and display KPI dashboards to your standard digital signage content. A couple of years ago our colleagues produced a video that walks you through the process of building your own KPI dashboard. It also shows how to use viewneo to display it and ensure that everyone gets up to date information.
You can start a free 30-day trial of viewneo today and bring your KPI dashboard to life. Just click on the link below to get started.


